
3
In a larger context this principle that suggests we ought to increase carbon dioxide from current levels in a clean and responsible way, is a principle that says we ought to strive to find ways to support, help, boost and protect nature as it supports a growing and thriving humanity.
These are my main claims on the subject of carbon dioxide and catastrophic climate change:
1. There is no doubt that we can increase all plant production significantly alongside agricultural output by staggering amounts with increased carbon dioxide in the atmosphere. With hemp that means a green abundance of almost all consumer products – food and feed, medicine and recreation, plastics, cosmetics, fuel, textiles, paper, building materials, etc.
2. No matter what bankers, politicians, CEOs, and others say, the science of catastrophic climate change is extremely flimsy. It’s a cavalcade of changed, cherry-picked and fraudulently framed measurements and computer models that are hysterically exaggerated over reality and pushed by a fervent activist culture in the mass media machine. The evidence strongly suggest increased carbon dioxide is overwhelmingly a plant life boosting agent and only a slight factor in a changing climate over hundreds of millions, millions, tens of thousands, thousands, hundreds and tens of years.
What to focus on instead:
- Animal welfare
- Real pollution (including smog and oil spills)
- Non-toxic, biodegradable bioplastics
- Honeybee colony collapse solution (some solution: organic agriculture and hemp)
- Decreased wood producing forest area (partly through hemp and selective surgical logging) and so we get more old magical forests
- Healthy, diverse reforestation
- Other terraforming. Perhaps connecting water to certain suitable barren low areas.
- Permaculture solutions and companion planting over excessive mono agriculture
- Clean oceans and lakes and replenish them with fish and sea life.
- Recycling, cleaning up and strong prevention of garbage in nature
- Space object and -phenomena observation and preparedness
- Protecting the electricity grid and IT from solar eruptions
- Pandemic prevention and antibiotic resistant bacteria cures
- Aquaponics
- Soil health
- Animal production through guided mass grazing and individual animal harvest via AI robotics. This is central part in greening desert areas.
First of all, before you dismiss this section off-hand, take into account that a lot of prominent scientists have risked their career and reputation to raise questions about the para-political climate program. That should be enough for you, as a civilized scientific-minded person, to research the basis for such claims. After all, you have been subjected to decades of daily climate hysteria from almost all of academia and mass media. Wouldn’t it be wise to give skepticism at least a few hours or days? This page only contains a loose summary and is based in the 3AO7LOVE-message. For a more formal format I suggest Tony Heller’s real climate science (dot) com. He also does a great job of giving a media historical perspective on climate/weather reporting.
List Of Prominent Scientists Whom Are Critical Of The Climate Science

Modern climate science is the equivalent of the geocentric flat earth model of our time in that it is highly anthropocentric (looks mainly at human influence), relies on computer models over reality and has a foregone conclusion (that of CO2 demonization). They actually manipulate the data to fit this conclusion. It is political propaganda disguised as science. It doesn’t resemble real science at any level. It is outright deceptive. By teaching the public at large about just three main statistical tricks that are used in climate alarmist circles the people would be well inoculated to their deceit.
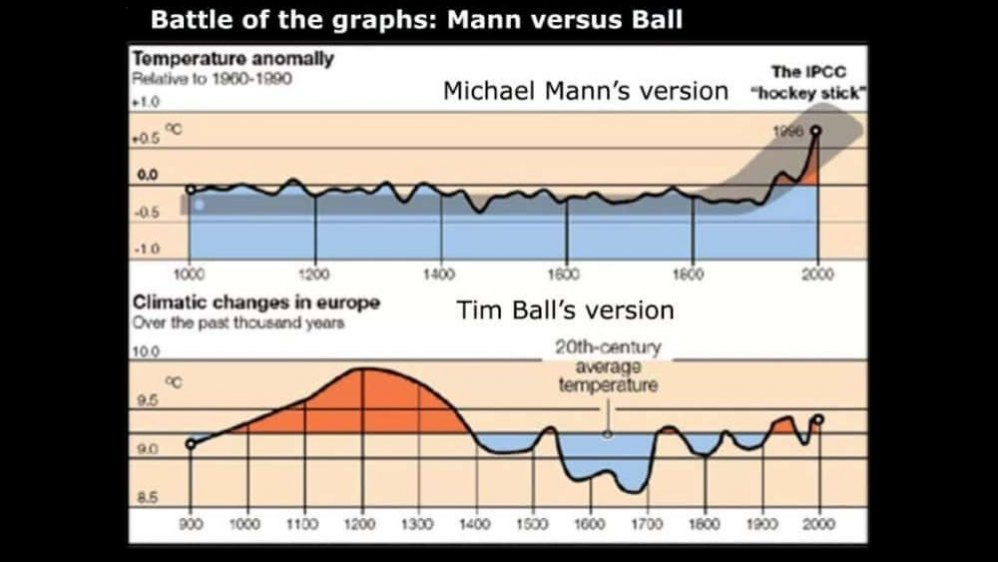
- They “correct” global temperature records to fit the alarmist narrative – cooling of the past and warming of the present; erasing the medieval warm period, for instance, as they discussed in emails in the 1990s, but also changing measurement records from the 1850’s onward.
- The starting point they use to show climate change related phenomena tends to be around 1980, which is the low point of a warming-cooling cycle with high points in the 1930s and 2020s; coming up from the latest big cold period some centuries ago.
- They don’t want to show people the carbon dioxide levels during the hundreds of millions of years of thriving life on the planet. They just show the minimal levels we’ve had the past million(s) of years at most.
- They cherry pick local climate changes and weather events that fit the alarmist narrative.
- About half of the measurement stations on land are next to air ports (huge heat-catching tarmacs).
This is how they change the data to make the past colder and present warmer. They cherry-pick and frame charts in a way to give a faulty picture. You heard that right, they don’t publish the raw measurement data, but instead “correct” the measurements to what they think “it should be”. Then the media runs with the most hysterical interpretation. When scientists finally correct the propagandist framing the correction is never reported on. Why is it impossible to escape constant climate alarmism while very few have even heard more levelheaded arguments? Here are just a few examples. Please continue down this rabbit hole. Once you’ve seen a few clear examples from their fairly simple box of tricks you’ll have a strong immunity to the lies:
How The Press Creates Fake Climate News
World’s second-worst scientist? (check out the deceptively picked data on wildfires)
Data tampering complete: Mission accomplished! (the manipulation of temperature measurements)
Winter, the white elephant in the room. (media lies compared to reality)
All charts used here are very common and largely uncontested except for some minor details. The only “controversial” chart is the last one that shows temperatures over the past 11 000 years as it contradicts the thoroughly debunked hockey stick.
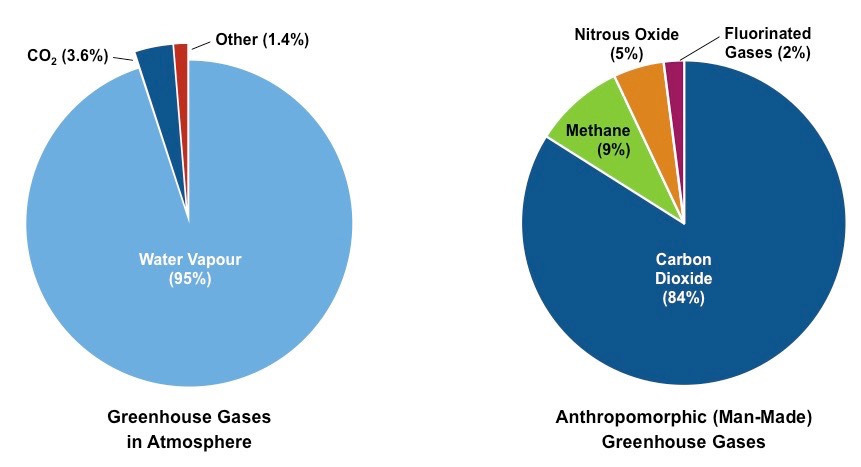
Carbon dioxide is a greenhouse gas; that much is true. That’s why few scientists deny we’re contributing to the mild warming by increasing it. Climate disaster is another matter. This is carbon dioxide’s part as a greenhouse gas. It’s a minuscule 0.04 % (400 ppm) of the atmosphere and only 3.6 % as a greenhouse gas. Most of the heat captured in the atmosphere is done by water vapor (95 %). Carbon dioxide’s true greenhouse gas property lies in it getting plants to thrive and make them more heat resistant. It’s not a magical heating knob, but a magical greening knob.
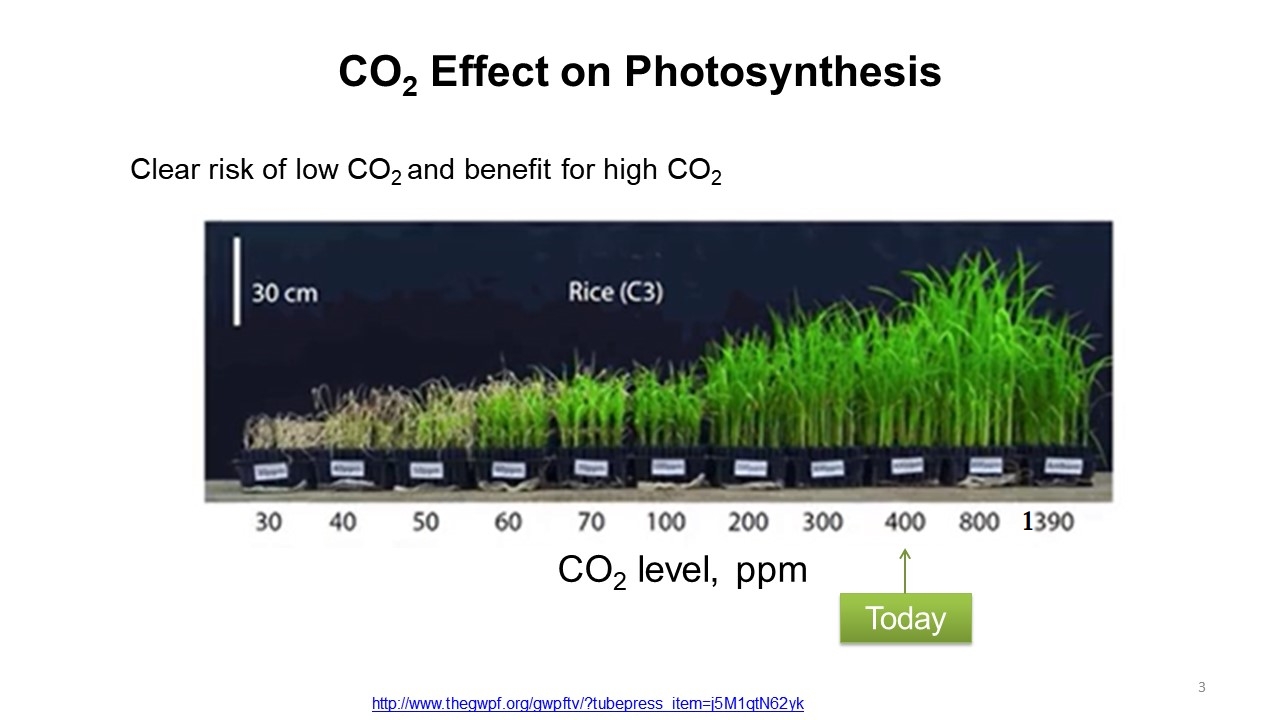
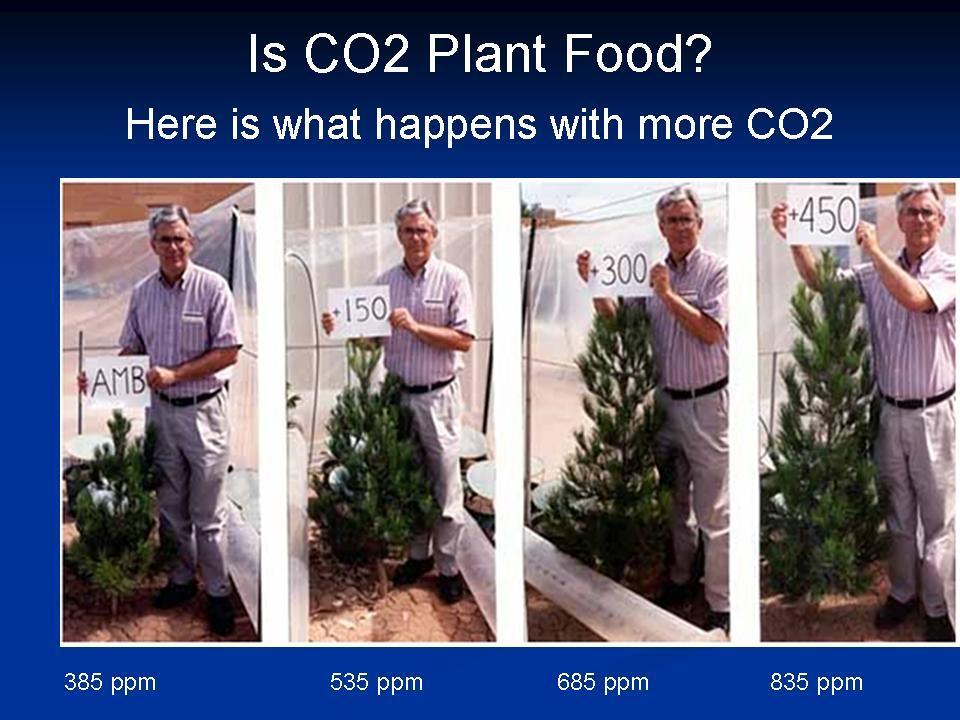
Fossil fuels are both cheap and plentiful energy as well as increased agricultural production due to higher CO2 levels. These fuels represent a big win-win for humanity at this stage. With increased fertilization we can expect a massive increase in biomass and agricultural output with higher CO2-levels. Around 1000 ppm seems to be the optimal amount for plants and it’s a low normal for thriving life on this planet. Therefore, my suggestion is that we increase the levels to that at the end of the century while regreening the planet. Here is a study of optimal levels for common grasses:
“The optimal CO2 levels… for the total biomass were 915, 1178, and 1386 ppm for tall fescue, perennial ryegrass, and Kentucky bluegrass, respectively.”

This might be the most important graph when it comes to CO2 and temperature. This is what the real relationship between carbon dioxide levels and temperature looked like over the past 500+ million years. There is no clear correlation. CO2 is a mild greenhouse gas. During 80% of post-Cambrian abundant plant and animal life’s history, we’ve had CO2 levels of 1000-5000 ppm. We’ve had ice ages at carbon dioxide levels of around 5000 ppm (see 439 million years BP). Therefore, the 1000 ppm, that I’ve drawn in green on the right edge, is not a radical proposal.
During the past 150 million years up to 90% of carbon has been sucked out of the atmosphere due to geological processes. We went from around 3000 ppm to under 300 ppm – 180-280 ppm as seen below.
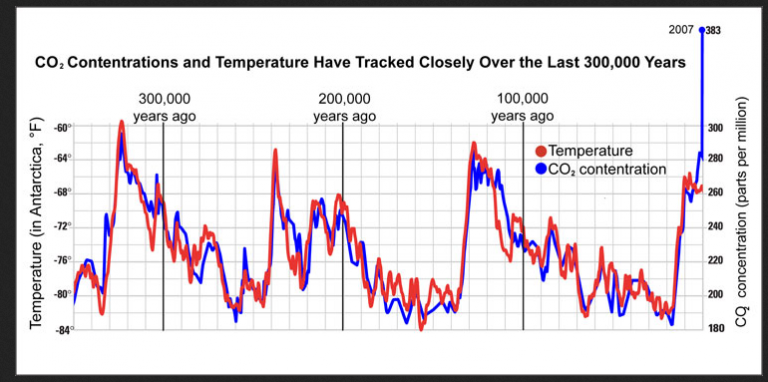
This is the time frame and data that is often used to push carbon dioxide hysteria. The CO2-levels have been hovering from180-280 ppm while plants start to die under 150 ppm. CO2 and temperature have tracked closely the past millions of years, but not in the way that propagandists propose. The CO2 concentration actually FOLLOWS the global temperature as warmer oceans can hold less CO2.

This is the temperature over the past 542 million years. We’ve been bouncing at all-time lows the past millions of years. We’re in an interglacial period – a short warmer period between ice ages. The past interglacial and ice ages can be seen between 10 000 and 500 000 years and the current interglacial is underlined in red. It can be seen in more detail below.

As illustrated, the temperatures have been fluctuating a lot during this interglacial period. We’ve been coming out of the little ice age for a couple of hundred years now so some warming is to be expected as per customary. Rest assured, the alarmist climate hysteria is a product of manipulated data and media propaganda. Thank God we’re able to easily increase carbon dioxide levels.